
Our taste for vanity metrics starts early. Take schools, in which most students receive grades. Does an “A” reflect the promise of a student’s future performance or actually show who's better at studying? On its own, doesn’t a “B” just signal “work harder” rather than “work smarter?”
Grades can easily slip into vanity metric territory, prizing comparison over advancement, and ego over evolution. They can become a tool for teachers to contrast students or for school boards to evaluate schools, rather than for students to improve. It’s easy to fall prey to the “A.”
Looker founder and CTO Lloyd Tabb sees the same phenomenon in tech. The metrics that are elevated — from daily active users to revenue growth — effectively compare companies, but don’t necessarily help them run better. In fact, these measurements often slant toward what investors want to measure, showing if a company is valuable, not how it can create more value.
It turns out, most of us are still hung up on getting that “A.” After three decades leading data teams at companies like LiveOps, Netscape, and ReadyForce, Tabb’s biggest learning isn’t what you would expect — or want to hear: You’re measuring the wrong metrics. We all are.
In this exclusive interview, Tabb shares how to abide by metrics that generate direction — not pats on backs — so that your company can act on what’s most essential to a business. He contrasts vanity and clarity metrics across a handful of types of companies — including service, advertising, software and ecommerce — to demonstrate how to find proxies that better predict behavior over time. Lastly, he emphasizes how to prevent teams from getting seduced by vanity metrics — and tips on honing their instincts for real, productive measurement.
Vanity Metrics vs. Clarity Metrics
For students, GPAs and SAT scores are key for getting into college. They’re single measures reflective of overall performance. You similarly need broad metrics, like number of users, to convince investors and advisors to believe in your company. These metrics serve a purpose — just not every purpose. “Vanity metrics aren’t useless. They have their use case, but are points of comparison for other people to evaluate you,” Tabb says. “Don’t focus on them internally. Tracking clarity metrics builds great businesses.” Here’s how he marks the difference:
- Vanity metrics are surface-level metrics. They’re often large measures, like number of downloads, that impress others. Use them to initiate partnerships and gain a following.
- Clarity metrics are operational metrics, like the number of minutes a day your product actually gets used or how long it took for a user to get service. These are the hidden gears that drive growth. Use them to solidify your competitive advantage.
Confusing the two types of measurements can be a recipe for disaster. Companies can get so enamored with vanity metrics that they fail to build a viable business strategy. “In 2014, a recruitment platform went viral by emailing a user’s Facebook friends after a sign-up. Their advisors and investors pressured them to increase daily active users [DAUs]. It’s all they focused on,” Tabb says. “The strategy worked: 33 million DAUs attracted $49 million of funding. All in less than two years. They were so focused on the single metric that they didn’t realize they were losing users just about as fast as they gained them, angering everyone in the process. They were a meteor until they fell to earth.”
Fuel up with vanity metrics and you might drive far enough to get an investment, but eventually you’ll run out of gas.
The company never quite recovered after focusing on growth to the detriment of their unit economics. “It’s like the old Monkey’s Paw fable. A father finds the Monkey’s Paw and is granted three wishes. He wishes for $200. His son is killed in an accident and he receives a $200 goodwill payment from the company. You get what you wish for, but there is always a sinister twist,” Tabb says. “Sometimes, when you focus on vanity metrics, you get the Monkey’s Paw.”
Here’s how Tabb recommends you find, measure and act on real metrics — across several types of business models:
Service-based Companies
If you’re selling a service, your vanity metric is most often the number of people using your service. Comparing your growth rate with your competitor shows who’s winning but doesn’t often reveal how or why. “For service businesses, find and measure proxies that lead you to capture the happiness of your customers. Your goal is to answer this question: are our customers getting good service? I know that’s a challenging question because service is subjective,” Tabb says. “Once you find a good proxy, measure behavior over time. Is behavior changing? If it’s getting better, than so is your business.”
How can companies find those proxies? Stepping outside your industry might help you think more openly and creatively. For example, imagine you are trying to evaluate good service at a restaurant. “There are a lot of expensive ways to measure attentiveness. For instance, you can calculate how many people are trying to make eye contact with their waiter. That’s not predictive because you don’t know if they are trying to get their attention or if they are bored with the people at their table. There is no general purpose measure,” says Tabb. “What you need is a measure that is easy to spot and not prone to misinterpretation. One option is you could measure the liquid level of all the glasses. At any given time, the percentage of glasses being full is a proxy for overall service. It’s a solid measure because it’s cheap to compute and easy to continuously observe.”
Zero in on the earliest act of service. Clarity metrics predict. For those in service-based companies, look earlier than you might to pinpoint that metric. Take car-sharing services. The often referenced metric is number of monthly active riders. “But that’s the vanity metric. It doesn’t explain why customers keep coming back or how services can improve. To make service better, measure pickup times. The faster the car comes the more likely I am to use the service again,” Tabb says. “The difference between waiting one minute and 10 minutes is a clear indicator of quality of service. Analysis of the data will probably show you a cliff of what’s acceptable in wait times. Tracking wait time failures across dimensions like neighborhood or driver will improve customer satisfaction and repeat business over time.”
This lesson especially rings true to Tabb, who spent a year poring over data at virtual call center company LiveOps trying to figure out how to predict call agent quality. No two calls were alike because the agents and customers were different. “I tried testing call length. My hypothesis was that if your call is short, you solved the problem faster and you’re a better agent. It wasn’t a strong indicator because it didn’t predict quality of service,” he says. “I tried percentage of calls in which agents made an extra sale. Of course, it predicted revenue, not service.”
Then it hit him. All LiveOps agents were independent contractors. They chose when they wanted to work. It was up to them if they showed up. “I zeroed in on the earliest act that could be measured: attendance. We started tracking who showed up and who didn’t. It turns out attendance was a proxy for accountability, which was the best measure of agent performance,” says Tabb. “It wasn’t obvious. It wasn’t even something that was happening on the call. It was a measure of character — and we had the data for it. But we had to find a proxy for it because there’s no standard measure of a good agent. The best indicator of success was whether you did what you said you would. We started routing calls to the best agents — those who did what they said they were going to do — and revenue jumped for all of our clients.”

Ad-based Companies
According to Tabb, advertising companies are dangerously susceptible to vanity metrics. But ad impressions represent exposure not results. They also don’t predict behavior.
“Enough companies have been burned to know that user attribution is what matters,” Tabb says. “If you don’t track click-through rates and purchase metrics in the same database, you just end up with a percentage of people who clicked on your ad. You have no idea what they did next. A million people can visit your website and not purchase anything. Averages are one-dimensional vanity metrics. Without context, they leave out the why.”
What you measure — users, clicks, transactions — coexists in the wild. So why are you siloing them in separate data streams?
Tabb cautions against siloing your data. “Your metrics influence each other. You need to monitor how,” he says. “Don’t just measure which clicks generate orders. Back it up and break it down. Follow users from their very first point of contact with you to their behavior on your site and the actual transaction. You have to make the linkage all the way through.”
If you are an ecommerce company, take it a step further. “Once you get a user, attribute where you got them, how much you paid for them, and the time it takes to recover from that acquisition cost. Don’t stay on the surface. You paid for those clicks. You need to know. And that’s the only way you’ll truly understand your customer’s lifetime value,” says Tabb. “We worked with an online fashion reseller that ran a bunch of free giveaways, figuring it wouldn’t take very long to make the money back once the new signups started acting like regular customers,” said Tabb. “But free is dangerous. They saw all kinds of bad behavior, and most of those new ‘customers’ never converted to more normal behavior. They were only able to see that because they tracked them all the way through, from click to acquisition to purchase.”
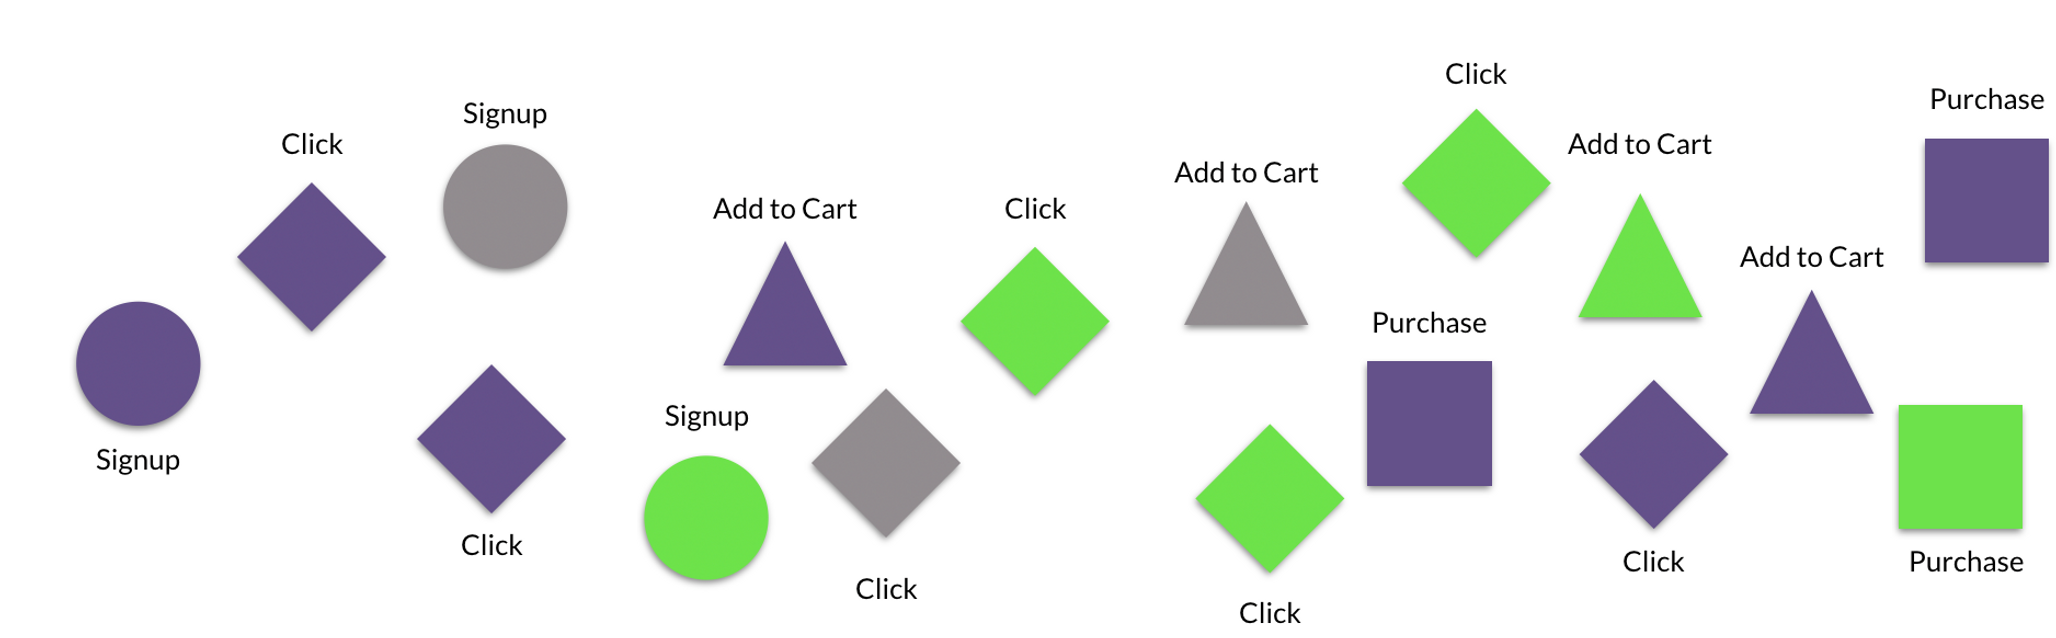
Organize your data into event streams. Siloed data will disguise real metrics. “First, centralize user activities and milestones into a single data stream. Event streams show how people move through your product and allow you to analyze their behavior,” Tabb says. “For many, it’s not the natural choice. Companies typically bucket their users based on demographic attributes or build their data into separate transactional tables. Separate tables are easier to read and make your software work. But they won’t give you a comprehensive view of what’s going on with your users through time.”
Answer these questions to start creating your event stream:
- When did the user sign up for our product/service?
- Have they made a purchase?
- How many active minutes do they spend with us?
- Where do they spend the most time? Where do they spend the least? What proxies predict this behavior?
- How does their behavior change over time?
- When or where do they stop using our product?
Tabb recommends trying a simple exercise after you create your event stream. “Count the number of active five-minute blocks your user spent with you in a day and look for clusters of action — and gaps of inaction — in their behavior. It's a cheap way of understanding what your customers are actually doing. Are they spending a lot of time on a page because they are interested or are they confused? If they are making a purchase, how many pages do they visit before they buy?” asks Tabb. “If you don't have your data arranged by time in an event stream, you'll never be able to answer these questions.”
Software-based Companies
When you are launching a product — whether an app or SaaS platform — the number of users is at the core of product/market fit — and a critical selling point for investors, partners and advisors. Tabb poses a counter argument here: How many times have you downloaded software you don’t use or use for a short period of time and forget about? “The number of people who download your product has no correlation with your company’s survival,” he says. “How many apps go on viral spins and wither months — even weeks — later? Software companies need to focus on active engagement minutes. That’s the clarity metric.”
Active engagement is the first metric Tabb measured at Looker: How many active minutes did people spend in the software every day? “I didn't care about revenue or number of users. When we got a new client, I needed to know whether they were actually using the software,” he says. “It’s easy for vanity metrics to misguide companies. One can boast that 90% of a customer’s employees have logins, but, how many people actually use it? If they do use it, are they navigating through it actively or just leaving it on in the background? It’s the same story with number of accounts. It doesn’t tell you how people use your product. Sometimes, you even have to call them and find out.”
Pick up the phone and call outliers. Every time Tabb finds an outlier in Looker’s user base he looks up the customer’s contact information and calls. During the early years, he did this daily. “I call people because I want to know how they feel using our software. If they aren’t using Looker, I want to know why. Is there something wrong? Are they stuck? If they are active users, I want to understand their experience and how we can improve it,” says Tabb. “I learned about calling outliers at LiveOps. When I noticed a set of calls that were statistically weird, I had the luxury of listening in to the calls. For example, one agent had particularly long calls. I could see that the agent spoke slowly, but the customer on the other end was really engaged, even more so than on other calls. Long calls, in this case, weren’t a bad thing.”
Early on at Looker, Tabb would look for lack of engagement. “When I noticed that the CEO of one of our first customers was just opening a couple of bookmarks that I had sent him but not actually rooting around in the data, I paid him a visit,” says Tabb. “It turned out he didn’t understand how Looker’s interface worked, and he wasn’t alone. I ended up setting up training for the whole company because of that. After the training, people at the company felt much more comfortable digging into data. It changed how we approach customers.”
A common mistake Tabb sees is over-reliance on A/B tests to decipher patterns in data. “There are exceptions. A/B testing can be helpful in select instances, such as when users don’t self-identify on a website. This type of testing can help identify otherwise anonymous users,” says Tabb. “But the vast majority of the time it’s not as helpful. First, if your data is siloed, A/B tests will tell you just the most immediate result versus the long-term outcome. For example, with a decreased size of the close button we saw double the clickthrough-rate probably due to mistaken clicks that didn’t ultimately convert. Even if you have billions of users, you won’t find any texture in your data if it’s siloed. Instead, study customer’s event streams. Call individual people. Start now. Do it often. Pick up the phone and have a real conversations.”
Software is getting people to think and behave in new ways. A/B testing is monitoring without interacting. Put down the binoculars. Pick up the phone and call.
Another way to zero in on active engagement is by mitigating what keeps users from using your product. In particular, tracking two rates can help: failure rates and poison rates. Here’s how:
Find — and slash — your failure rates. A failure rate is the number of times your company is unable to deliver on its promise. A failure rate is a shared operational metric for all businesses — not just security. “To get the failure rates for your company, find them in each department first. Every function will have a different failure rate to assess their work. For customer experience it’s how many times a CX rep fails to solve a customer problem. For supply chain, it’s how many times do customers try to purchase a sold out item,” says Tabb. “Every team member needs to know and monitor the failure rate for their specific role and department. Every time you change your process or product, the measure of your failure rates need to be adjusted. If you’re just getting started, use free tools to identify failures and find patterns. Have your web developers use Google Analytics to check how often your 404 or Internal Server Error page loads. Have Support use a free survey tool to survey a sample of support tickets about their satisfaction.”
Failure rates aren’t sexy external metrics, but they can bring sanity to a business. “Once, [mobile payments company] Venmo made a design change that made it easy for users to accidentally send money when they meant to request it. On one hand, this drove vanity metrics, like number of transactions, because each mistaken money transfer needed an extra one to counteract it,” says Tabb. “But it was a disaster internally. Users were disoriented and couldn’t control their payments as they wished. Venmo pinpointed that particular pair of transactions — a payment and a ‘reversal’ that mirrored that transaction — to test if the new design was the cause. The team’s hypothesis was correct and they solved the problem.”
Failure rates keep small fractures from turning into breaks. Vanity metrics rarely are preventative.
Prize your poison rate. A subgroup of failure rates, poison rates are when customers have such a terrible first experience that they don’t return. “It’s similar to when you get food poisoning at a restaurant. It’s nearly impossible to recover a customer after that experience,” says Tabb. “Companies rarely measure poison rates but they can be powerful levers when trying to control the growth of your user base. Not only do you lose a potential customer, you lose the people they’re likely to refer. In the social media age, poison is toxic.”
Marketplaces are the highest risk. “Take Airbnb. Does a particular rental have a high poison rate? It may have great attributes: good size, great location, competitive price — but people stop using Airbnb completely after staying there. Now that’s a telling clarity metric versus, say, number of booked stays per rental. That’s a vanity metric until you dig in and find out the rental is actually hurting your business,” says Tabb. “There are a lot of factors out of your control with marketplaces — find and prize your poison rate. It’ll actually help you bring some order to the chaos. It’ll allow you to understand your initial losses and whether it is possible to recover.”
E-commerce Companies
E-commerce companies are loyalty businesses. To win the market, you need customers to repeatedly choose you over competitors. “E-commerce is about opportunity costs. You have to find and measure proxies that inspire customers to order again and again. It’s about how often customers buy, not how much,” Tabb says. “Real metrics — like those around shipping and delivery — are less sexy than basket size or revenue, but they drive repeat behavior over time.”
“The clear example is Amazon. From an outside perspective, Amazon Prime is a loyalty program. Does free, two-day shipping make you buy more often? Absolutely. Amazon knows if you consistently receive your items faster, you’ll return when you need something,” says Tabb. “They’re right. Prime members spend an average of $1,200 a year. Non-members spend $500.”
Netflix embraced a similar metric during the early days. The company sent a survey asking what day users received their DVD in the mail. “They measured delivery time to see if they needed to build more distributed service centers to decrease ship time. Amazon is likely doing the same thing. The company focuses on over-delivering on their promise, not on revenue. They invest in air fleets and drones because they are relentless about exceeding your expectations.”
Lean into logistics to lift loyalty. Every company has some clarity metrics tied to logistics. The goal is to build reliability and eliminate surprises. That builds loyalty. Answer these questions to pinpoint your real metrics for logistics:
- Which customers order most frequently?
- What traits do they have in common?
- Can you identify a noticeable turning point when they started ordering more?
- How can you strengthen your offering to them?
- What features can you build to inspire similar loyalty among other customers?
Develop Your Data Sense
Every business model has its vanity metrics — and its sanity metrics. Rest assured, you already have the data to help you tell the difference. You just need the discipline. Start by elevating metrics that predict the behavior of individual customers over time, not just capture a snapshot in aggregate for comparison with competitors. Organize your event stream to provide a chronological view of how people move through your product so you can test parts of it. Don’t fall into the A/B testing trap. Instead, call your customers when you spot a blip in their behavior. Data can’t reveal how people feel. Make sure every department understands their failure rate and is equipped to decrease it. Your logistics are key levers of your business. Teach your team how to siphon and see data. You need a team of data detectives, not a single Sherlock.
“Data fluency isn’t just for tech anymore. Every department in every company must invest in it: customer support, design, business development. They should be parsing through data to find proxies. When they find an outlier, they’ve got to be ready to dive in. You can’t scale if there’s a line outside your data team’s door. Host an AMA about event streams and showcase your data scientists. Let people shadow the data team or embed data scientists in teams like design and customer support,” says Tabb. “I see a world where people can explore data the same way they find information via Google. When you first used Google, it took time to learn how to pull what you wanted out of it. Eventually, you learned how to get what you need — and when you did, you had this amazing click-through view of the world. Data-wise, most companies don’t get past the ‘first page of search results.’ But now, that’s a choice, not a reality. Don’t settle on vanity metrics. Get caught looking in the mirror and you’ll miss the world that’s changing around you.”
Photography by Studio Holladay.